Versatility of PoKeys device makes it well suited as a component of an environment monitoring system. PoKeys device functions as a data acquisition point, as many different sensors can be easily connected to it. Acquired data can we store directly with PoKeys software logger or send to local, for example Raspberry Pi temperature logger or remote server (ThingSpeak IoT service) where it is logged and processed.
In our previous blog we have presented using PoKeys and sending data to remote ThingSpeak service. Now, here is described a way how to use PoKeys57E (Ethernet version of PoKeys) with PoSensor2 board and Raspberry Pi temperature logger as a local server.
However, this example is tested with Raspberry Pi 3 model B. Other Raspberry Pi versions should also work. Any other Linux capable hardware with Ethernet support and installed Node-RED can also be used as logging setup. Configuration should be quite similar to this example.
Setup Raspberry Pi data logger as local server with Node-RED
There are many ways how to setup your Raspberry Pi that should work fine with this example. As an example we will present probably most standard way with officially supported Raspbian OS.
First you have to download Raspbian OS and burn it to your SD card. You can get it at this link. You can choose between two versions, full or lite. Lite version is meant for headless installation i.e. without monitor, mouse and keyboard. We will use full version, as it comes with pre-installed Node-RED and it is a bit easier to setup. Use etcher to write downloaded image to your SD card.
Now you can insert SD card into your Raspberry and start system up. After system has booted, static IP must be assigned to your Pi, otherwise you will have to reconfigure your PoKeys on each reboot of your server. This can be done by editing dhcpcd.conf file in /etc folder.
Edit the dhcpcd.conf file
Add (or uncomment) following lines:
interface eth0
static ip_address={STATIC_IP}/24
static routers={GATEWAY_IP}
static domain_name_servers={PRIMARY_DNS_IP} {SECONDARY_DNS_IP}
This is example of our configuration, where Raspberry have IP address 192.168.0.150:
interface eth0
static ip_address=192.168.0.150/24
static routers=192.168.0.1
static domain_name_servers=192.168.0.1 8.8.8.8
After next reboot these settings will take effect. You can reboot by command:
pi@raspberrypi:~ $ sudo reboot
When system has restarted, open terminal window and start Node-Red with command:
pi@raspberrypi:~ $ node-red &
You should be seeing output like this:
Welcome to Node-RED
===================
14 Mar 20:58:51 – [info] Node-RED version: v0.18.4
14 Mar 20:58:51 – [info] Node.js version: v4.8.2
14 Mar 20:58:51 – [info] Linux 4.9.80-v7+ arm LE
14 Mar 20:58:51 – [info] Palette editor disabled : npm command not found
14 Mar 20:58:51 – [info] Loading palette nodes
14 Mar 20:58:57 – [warn] ——————————————————
14 Mar 20:58:57 – [warn] [node-red-node-pi-sense-hat/sensehat] Error: Can’t find Sense HAT python libraries. Run sudo apt-get install sense-hat
14 Mar 20:58:57 – [warn] ——————————————————
14 Mar 20:58:57 – [info] Settings file : /home/pi/.node-red/settings.js
14 Mar 20:58:57 – [info] User directory : /home/pi/.node-red
14 Mar 20:58:57 – [warn] Projects disabled : set editorTheme.projects.enabled=true to enable
14 Mar 20:58:57 – [info] Flows file : /home/pi/.node-red/flows_raspberrypi.json
14 Mar 20:58:57 – [info] Creating new flow file
14 Mar 20:58:57 – [info] Starting flows
14 Mar 20:58:57 – [info] Started flows
14 Mar 20:58:57 – [info] Server now running at http://127.0.0.1:1880/
Headless configuration differences
When you want to setup Raspberry Pi temperature logger without monitor, keyboard and mouse, there are some differences. First, after you burnt image to SD card, you have to enable ssh by adding empty file named ssh to boot partition. This will enable login through ssh to your freshly installed system. Default user is pi with password raspberry.
By default, Raspberry pi will acquire IP address from DHCP server. This IP can be found in DHCP leases list on your router. You will have to login to your router and find DHCP leases list in router settings. As this step is different for each router, we cannot supply detailed instructions for your specific model. Please consider your router user manual.
After you have found your Pi IP address use SSH for connecting to your Pi. Do not forget to setup static IP configuration as is described in previous section. You can use nano command line text editor. If you have used Raspbian lite version as is common for headless installations, you have to install Node-RED. This is done with command:
pi@raspberrypi:~ $ sudo apt-get install nodered
Now you can start Node-RED with command:
pi@raspberrypi:~ $ node-red
Raspberry Pi temperature logger – Configuring Node-RED
When you have started Node-RED on Pi, you can access with browser as a web page on address http://{PI_STATIC_IP}:1880
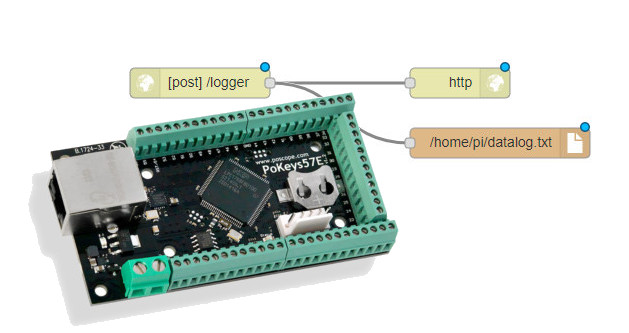
Pick nodes on the left side of the web page and drag them to a centre window to create a flow, shown on picture bellow. You have to pick nodes:
- input: http
- output: http response
- storage: file.
To drag a line, click a small box on the edge of the node.

To configure a node double click on the node.
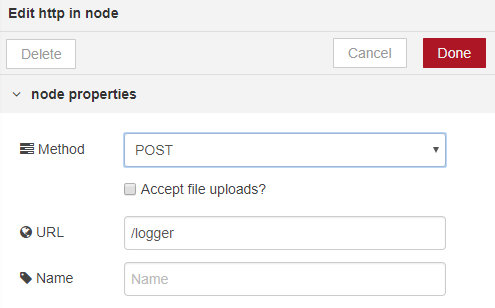
Node input: http
Select POST method and enter URL /logger and click Done.
Node storage: file
Enter full path of a file where you want to have data. In our example this is default home folder of user pi, /home/pi and file datalog.txt.

Node output: http
This node does not need any configuration.
After you have finished with configuration of the nodes, click Deploy on upper right part of the webpage. Now your Pi and Node-RED are ready to accept and log data on web address http://{PI_STATIC_IP}:1880/logger.
Configure PoKeys for web reporting measured data
Now is the time to configure your PoKeys Ethernet device for web reporting. First you will have to setup web dashboard and some sensors. In this example we will use PoSensor2 board, but you can use any other sensor supported by PoKeys.
PoSensor2 configuration with PoKeys
PoSensors2 is newly developed board from PoLabs with improved lower power sensors. It features 6 in 4 sensors, which are temperature sensor, humidity sensor, light sensors for IR and visible light, 3 axis accelerometer and 16 bit analog to digital converter. PoNET connection is used for connection to PoKeys device.
Connecting and configuring PoSensors2 board to PoKeys is very easy and straightforward. PoSensors board comes with cable for connecting it directly to PoKeys device PoNET/PoExtBus connector. After you have connected sensor board, you have to configure it PoKeys. To do this, open EasySensors configuration from Peripherals menu. Click Scan for i2c sensors. All detected sensors will be listed here as you can see on picture 4. Select all sensors you want to read and optionally set desired read interval. To close the window, click Finish button.

Now all selected sensors are listed in EasySensors setup window. To start reading click Send to device and Refresh values. Fresh sensors values will appear on the list and will be updated in selected update interval for each sensor as is shown on picture 5. If you want to save sensors configuration to PoKeys device, please click Send to device on main configuration window after you have closed EasySensor setup window.

PoKeys web interface dashboard configuration
On picture 6 bellow you can see all sensors available on PoSensor2 board already configured. To add new device, click Add new button. This will add new device to the list, that must be configured before use. Data source can be sensor, detected by EasySensors module, PoKeys pins, encoder or others. For detailed sensor configuration please look at PoKeys user manual.

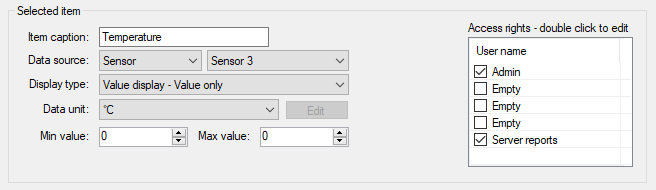
Item configuration depends of your respectable data source. On picture 7 in this example we can see sample configuration for temperature sensor. Do not forget to select Access rights for Server reports in window on the right side for all sensors you want to log.
PoKeys server reports configuration to Raspberry Pi temperature logger
After you finished with web dashboard configuration (or you had it already configured), server reports configuration must be updated. You can open it directly from web interface dashboard configuration windows by clicking Open report server configuration button or by opening Device drop-down menu and clicking Server reports configuration … option.

Here you have to enter IP of your Raspberry Pi data logger server into Server IP window and Port number, as is market on picture 8. Here you can also change update interval. In our example we have ip 192.168.0.150 and port 1880 with update interval 60 seconds. You also have to edit http header to look like this:
POST /logger HTTP/1.1
Host: 192.168.0.150
User-Agent: PoKeys57E
Content-Type: application/x-www-form-urlencoded
Do not forget to change Host IP address in header to your Raspberry Pi IP address. If you used different logging url, change the first line accordingly. Now you have to click Send to device and Close. To save your settings on PoKeys device click Send to device button in main configuration window. If everything was done correctly your PoKeys is already sending data to Raspberry Pi data logger, which are writing it to a file. You can check your file with command:
pi@raspberrypi:~ $ tail -f datalog.txt
{“AccX”:”0.96″,”AccY”:”0.02″,”AccZ”:”0.07″,”Temperature”:”22.89″,”Humidity”:”23.71″,”Light_Indoor”:”17.81″,”Light_Outdoor”:”2.66″,”IR_Indoor”:”105.20″,”IR_Outdoor”:”2.99″,”Reflection”:”2.40″}
{“AccX”:”0.96″,”AccY”:”0.02″,”AccZ”:”0.05″,”Temperature”:”22.94″,”Humidity”:”23.78″,”Light_Indoor”:”19.55″,”Light_Outdoor”:”2.67″,”IR_Indoor”:”114.29″,”IR_Outdoor”:”3.02″,”Reflection”:”2.49″}
This will interactively show you last few lines on your log file. When new line is added, it will be displayed immediately. Data is saved in JSON format but can be converted to CSV by adding additional function: CSV node in NodeRed.
Please check one of our previous blog where we have presented using PoKeys and sending data to remote ThingSpeak service.
Also, you can check some our products:
- Stepper motor driver-PoStep60-256
- Stepper motor driver-complete explanation
- USB CNC CONTROLLER-PoKeys57CNC
- Homing sensor-PoHome1IRNPN
- plasma voltage divider
- bipolar stepper motor driver – PoStep25-256
- PCB tester – PoStep25-256
- 4th axis for CNC
- Introduction to CNC hardware – electronics
- plasma cutting equipment
- what is CNC plasma cutting
- What is CNC plasma floating head
- plasma cutter troubleshooting guide
Related Posts